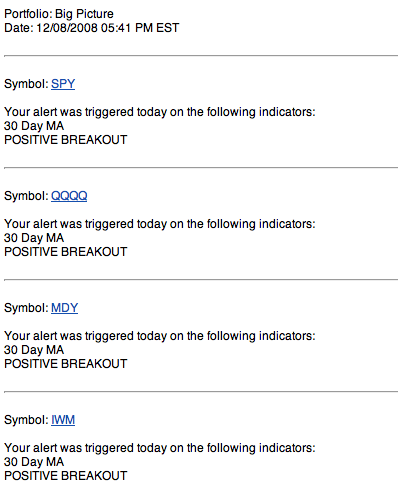
 I love it when the days come when an email alert like this lands in my box.
Surely it does not, by itself, tell too much or give reason to think that we’re in a whole new market now and all is well. But it’s certainly not a bad sign. Big cap, mid cap, small cap and tech, all breaking above the 30 day MA.
Before going on with the normal stuff of the market posture, let’s look at the bond market, shall we? Yes, I think we shall.
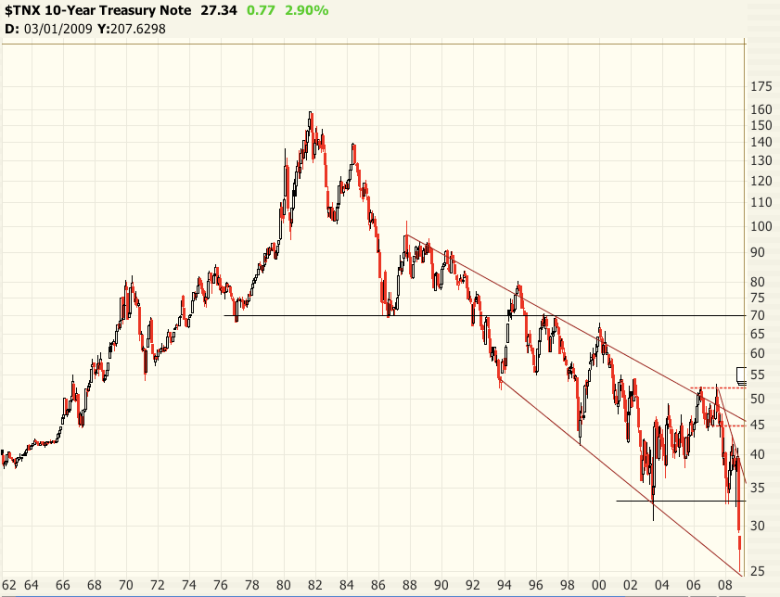
Below is the chart of the yield for the 10 year Treasury Note for as long as the data is available on my charting program. We are at record lows for this yield since the ’50s.
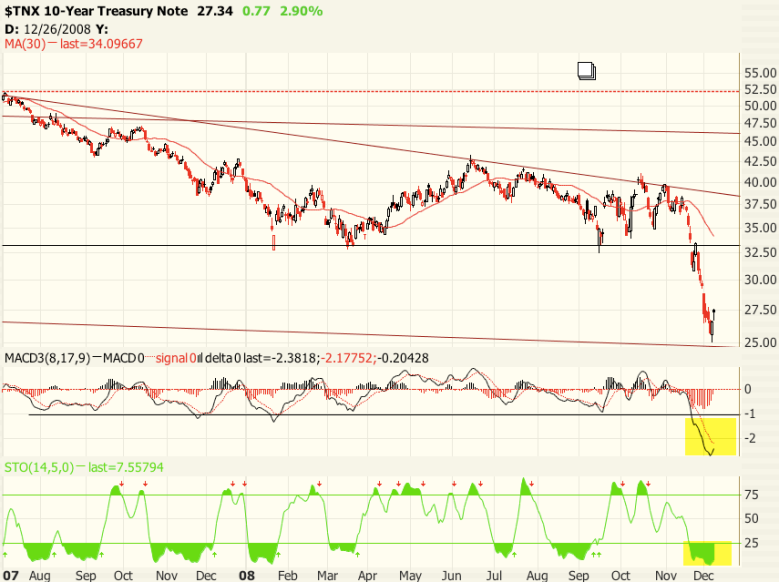
Then look at chart for the year. Looks pretty nasty. The yield has plunged as investors have taken the “flight to safety” in buying bonds. But perhaps they’ve overshot the market a bit, at least for the time being. A move back to just above 30 or 3% would still be below the 38% retracement from the last peak in the end of October.
The daily shows a chart that looks to have just fell through the floor. Notice how extremely extended the MACD is on the down sides and how oversold it has been on the Stochastics. I don’t mean to say that THIS is the bottom. But it seems a bottom or reversal pattern of some form may begin to materialize here in the coming stretch. This potential rising of the yield will be accompanied by the selling of bonds. You can track that with some ETFs. TLT for the 20 year bond and the TBT is an inverse of the same thing, so you can play it the other direction without having to short anything.
Now if it is true that investors tend to move money out of stocks and into bonds for safety, what happens if the bond market turns over and bond investors/traders start bailing out of bonds? Perhaps some or much of that money goes back into stocks, even if with some trepidation. Who knows?
In any case, here is the long term picture of the DOW. I don’t mean to sound like a hopeless bull, which maybe I am, but this seems to have been beaten down with every thing in the broom closet. Reversals are, I believe, said to come in the form of volatile extremes. I’d say the last couple months would match that description. We’re far from out of the woods, but it seems that optimism may be making an appearance.
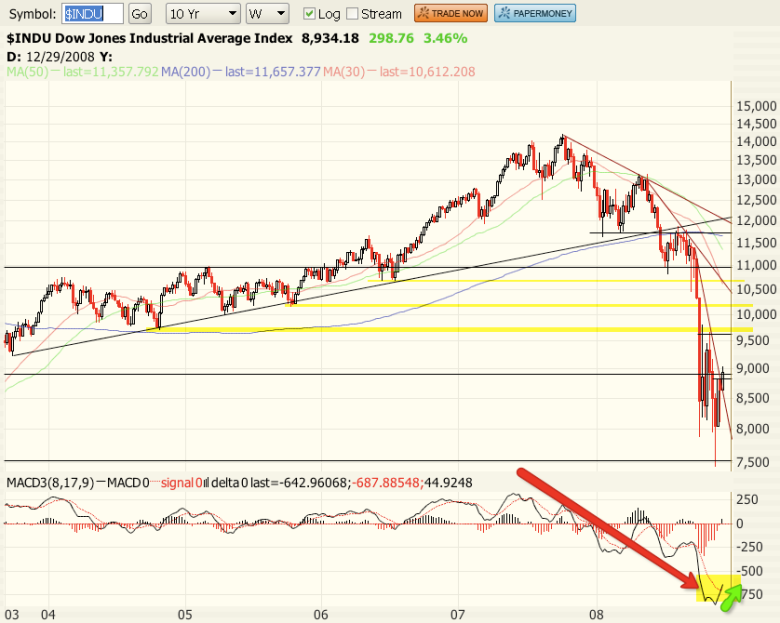
And though it is only just a start and hardly sufficient for the all clear, today the index broke above the 30 MA, the downtrending resistance line from September, and began a short term uptrend with a higher low and now a higher high. To boot, it is coming off a bullish divergence with the MACD lines. This is when the Index forms a lower low while the MACD lines form a higher low.
Doesn’t a target of 10,000 or even 10,500 seem pretty reasonable? We’d still be in the nasty bear market!

Now for the VIX. It is in the middle of a range which could turn out to be a double top. Today we have a breach of the uptrend support line which is a first signal we need for a sign of better things to come. Then a move below the recent closing lows of 55 and then 47.75. Getting and staying below 48 would be pretty meaningful, I’d think. For now, I’ll call this neutral/bullish.
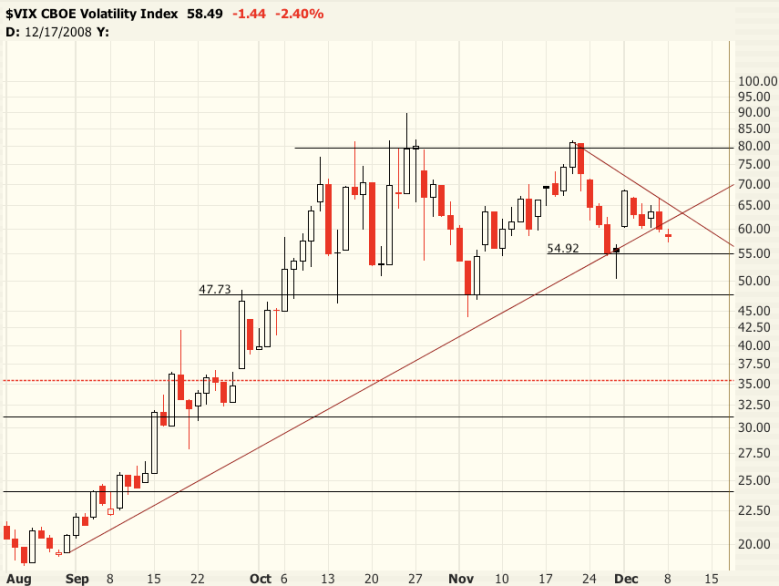
A move back above 80 on a closing basis and all bets are off. The markets would likely be on their way to testing the lows again.
The SPX still has a considerable amount of long term momentum to the downside, most immediately in the form of resistance at the 50MA. Nevertheless, we must recognize that it has broken through the shorter MAs and now has begun an uptrend with a higher low and now a higher high.
The Market Forecast shows a nicely upward trending green intermediate line. That with the longer term sentiment line flattening from its dive and almost edging upward makes for what I’d consider a bullish Market Forecast reading.
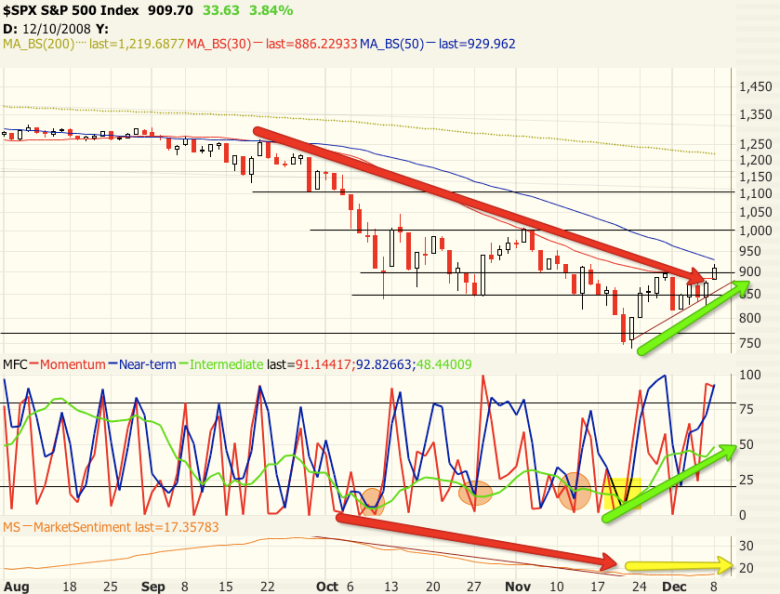
The one cautionary note I should mention is that I don’t believe V-bottom reversals are very common or quite as stable as other bottoming patterns. I haven’t read IBD much at all for many months, so I don’t know how well their Big Picture market outlook has been, but I believe they now consider us in a confirmed rally as of at least Thursday.
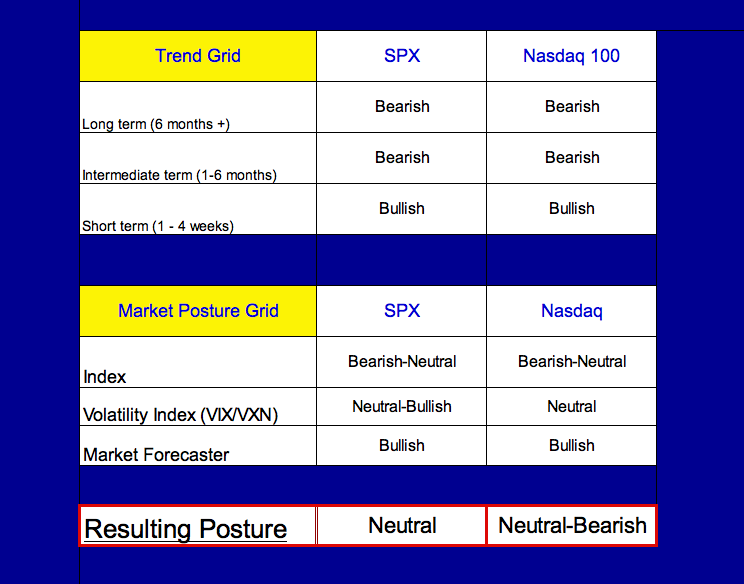
Anyway, here’s the big grid and resulting posture as I have figured it.
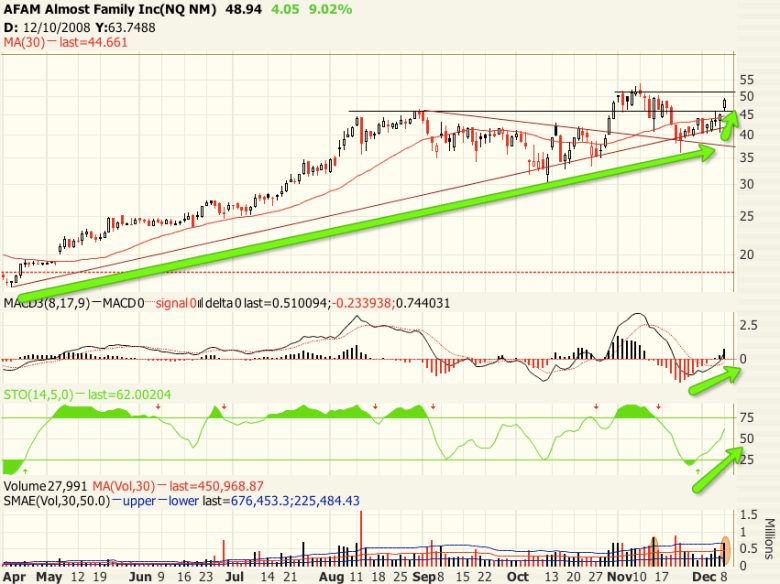
By the way, AFAM was number one on the current Monday IBD 100. Using the old fashion method searching on Investools for strong sector groups and stocks within those, I found this stock a few months ago and bought it and was then stopped out. The point? We don’t need IBD or whoever else to find good stocks.
The stock gave three fresh green arrows yesterday, though its group chart is not exactly bullish. This may or may not launch for a big run, but the IBD readers will likely continue to load up on this as and if it pushes through the pivot point around 52.50. If you jump in, be prepared for a quick failure or “fakeout,” particularly if the market doesn’t continue to rally.
Be aware that while today’s volume spike is certainly legitimate in size, it is still only under 1 million shares and much of that was likely due to buyers chasing IBD stocks as opposed to institutional investors who will sustain the real movement.
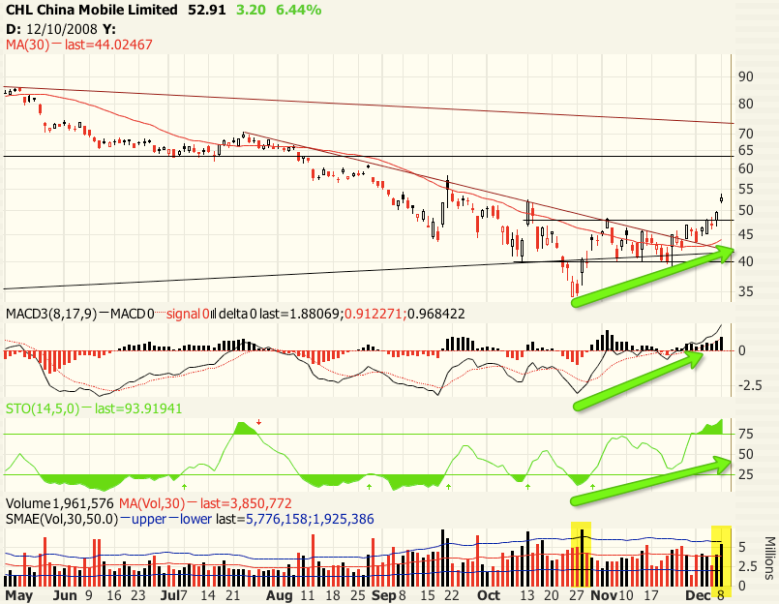
If the double bottom on the market in China holds up (FXI), CHL could be a nice one to watch for an entry on a pullback to support.
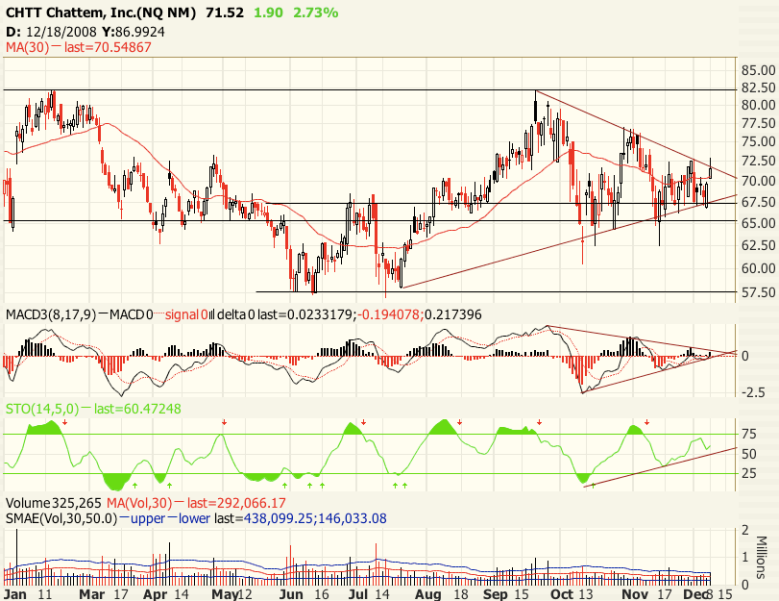
CHTT with an interesting symmetrical triangle setting up. 82.50 would be a nice initial target. Beyond that point, it would be entering a Stage 2 bull movement again after basically a year of wide swinging sideways action.
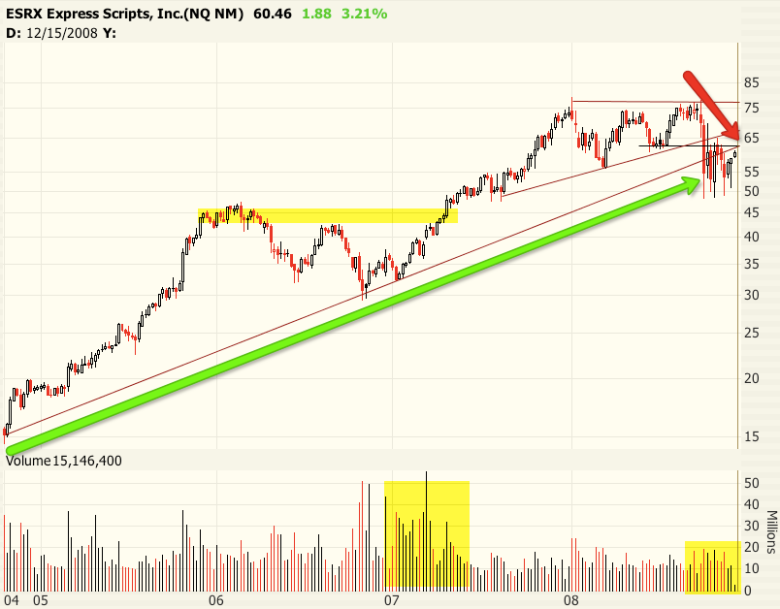
ESRX is in an interesting point in the long term view. Seems it could go either way. Interesting thing is that while the volume through this recent breakdown has been high relatively high on the selling side, but the overall volume still pales in comparison to the buying volume that brought it up and above the 45 buy point in early ’07.
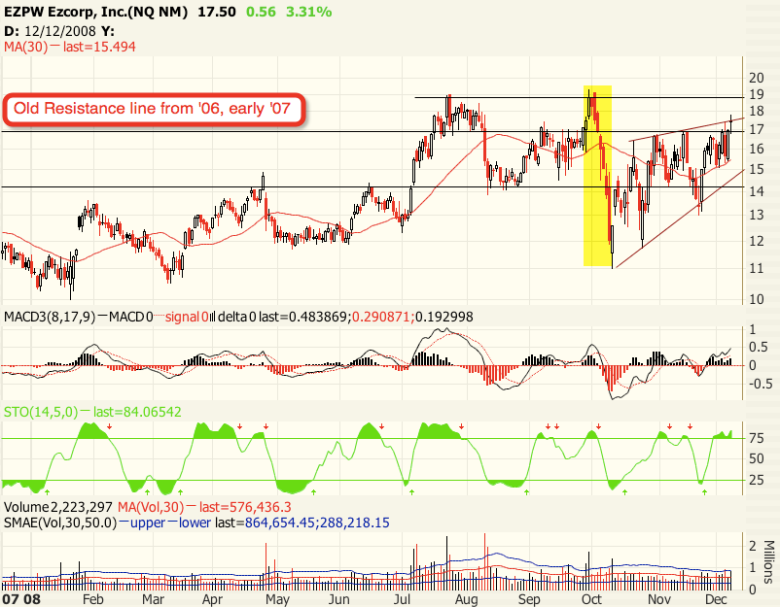
EZPW is in a strong group and looks to be trying, though it looks a bit dubious. That sell off in early Oct was nasty! And now we’re in a rising wedge, which is supposed to break to the down side. With that resistance at 19 it might even be watched for an aggressive short entry with a well defined stop if the market rally fails. But don’t forget to look at its earnings growth. Very nice and steady to date.
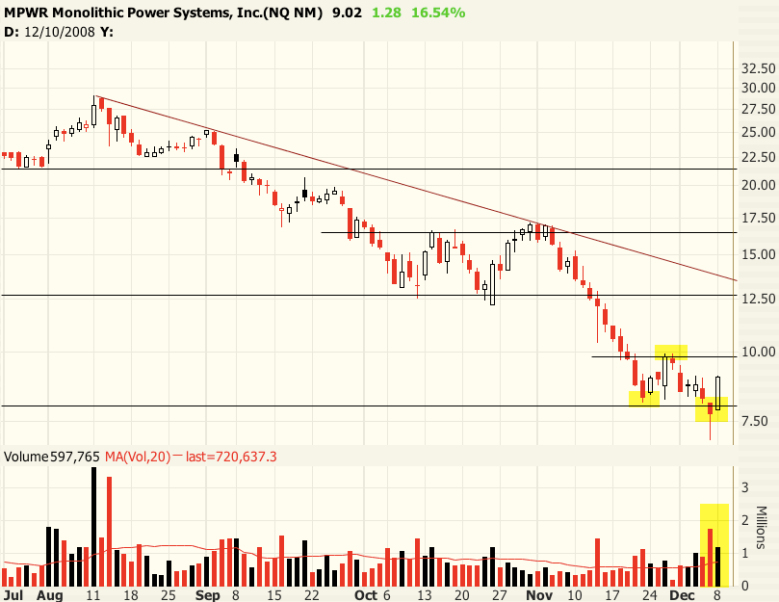
MPWR and the semi-conductors aren’t winning any popularity contests. But this one looks to have put in a capitulation bottom and nice follow through day today. It is forming a nice, clean double bottom with a distinct entry point just under 10.
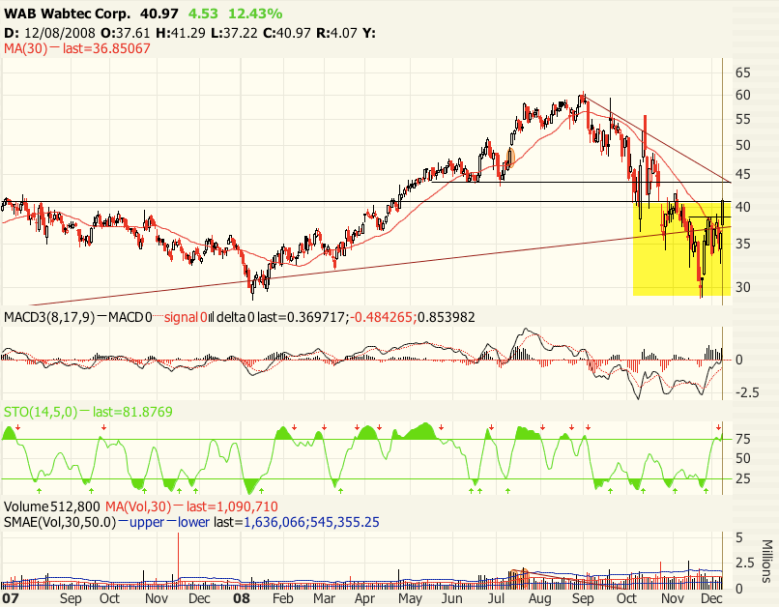
WAB, from the relatively strong railroads group, has an inverse head and shoulders pattern forming, if a bit ugly.
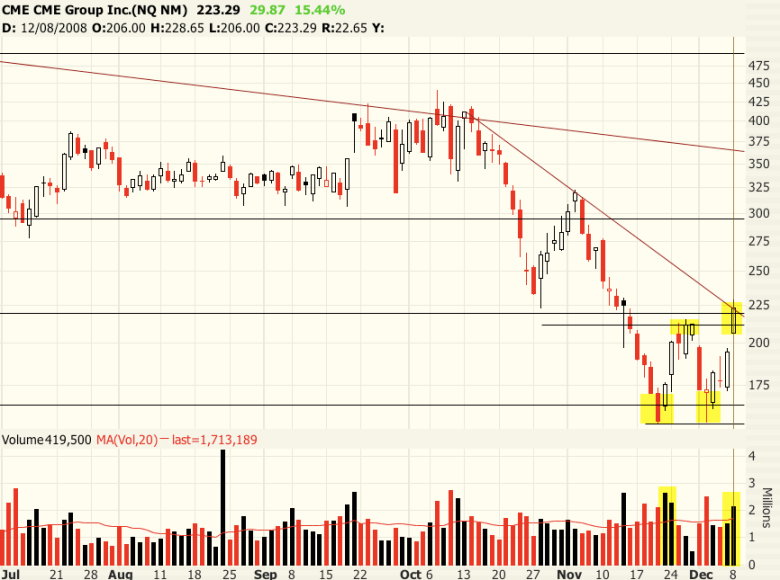
CME has a double bottom reversal pattern with a buy trigger today and a projected taret of about 265 in the short term.
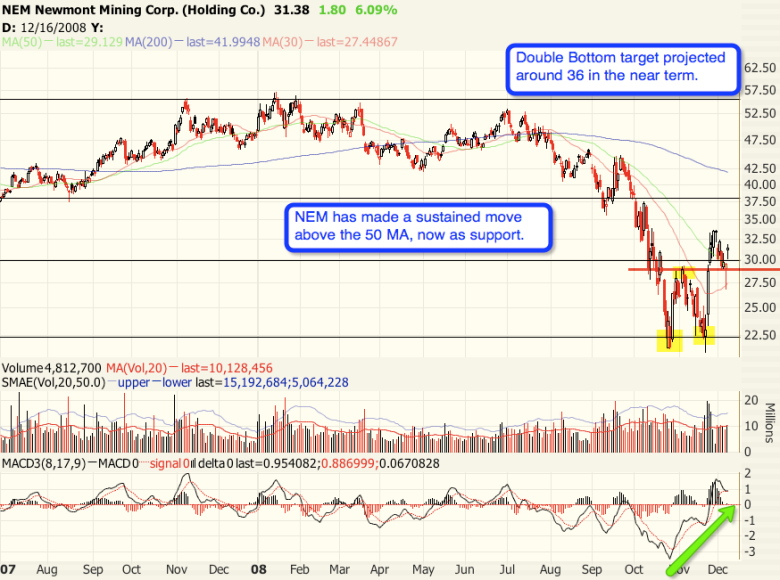
Could Gold stocks be ready to come back? Here’s NEM with a nice Double bottom reversal. ABX is similar
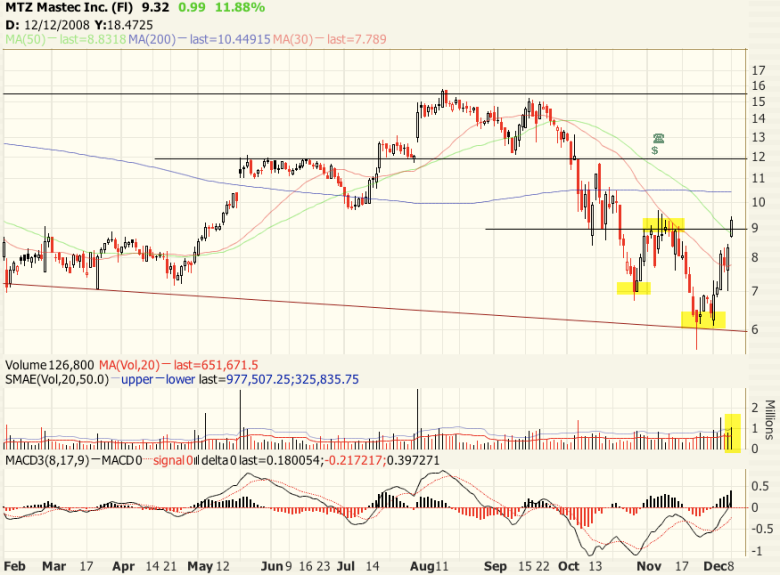
Finally, for an Obama infrastructure play, this one might just applicable. Double bottom breakout today with a projected target of about 12. Long term chart is fairly ugly, though.
Well, that’s all for now, folks. Hope it makes some sense to you. 🙂
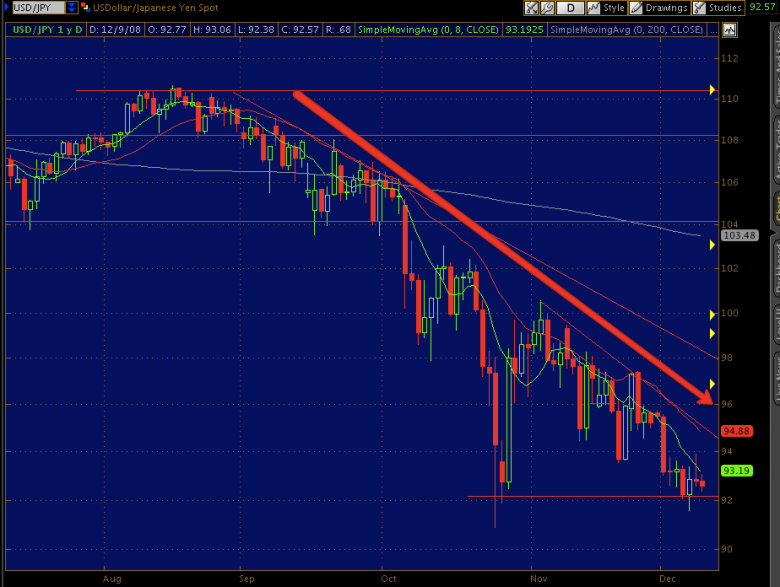
P.S. Can someone explain to me what’s going on with the USD/JPY. Wasn’t this supposed to have a positive correlation to the stock market? Is the “carry trade” no longer an issue?
